
Patrik Liu Tran
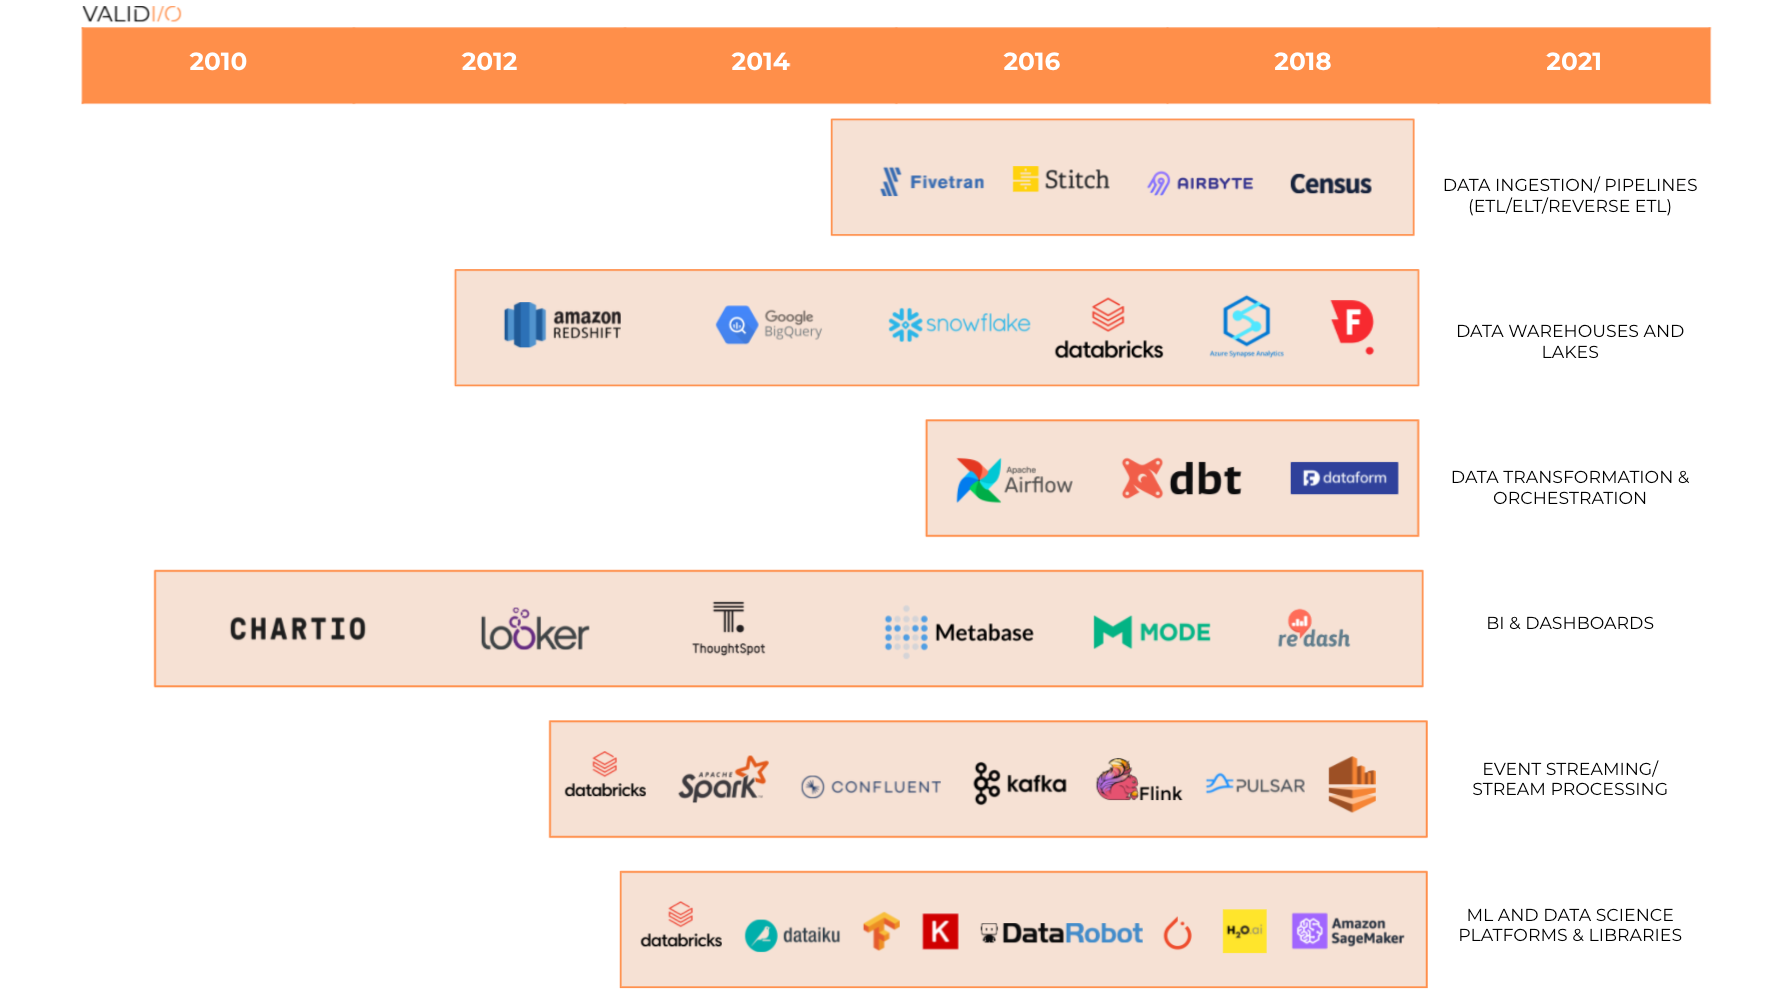
A little over a decade has passed since The Economist warned us that we would soon be drowning in data. The modern data stack has emerged as a proposed life-jacket for this data flood — spearheaded by Silicon Valley startups such as Snowflake, Databricks and Confluent.
Today, any entrepreneur can sign up for BigQuery or Snowflake and have a data solution that can scale with their business in a matter of hours. The emergence of cheap, flexible and scalable data storage solutions was largely a response to changing needs spurred by the massive explosion of data.
Currently, the world produces 2.5 quintillion bytes of data daily (there are 18 zeros in a quintillion). The explosion of data continues in the roaring ‘20s, both in terms of generation and storage — the amount of stored data is expected to continue to double at least every four years. However, one integral part of modern data infrastructure still lacks solutions suitable for the big data era and its challenges: Monitoring of data quality and data validation.
Let me go through how we got here and the challenges ahead for data quality.
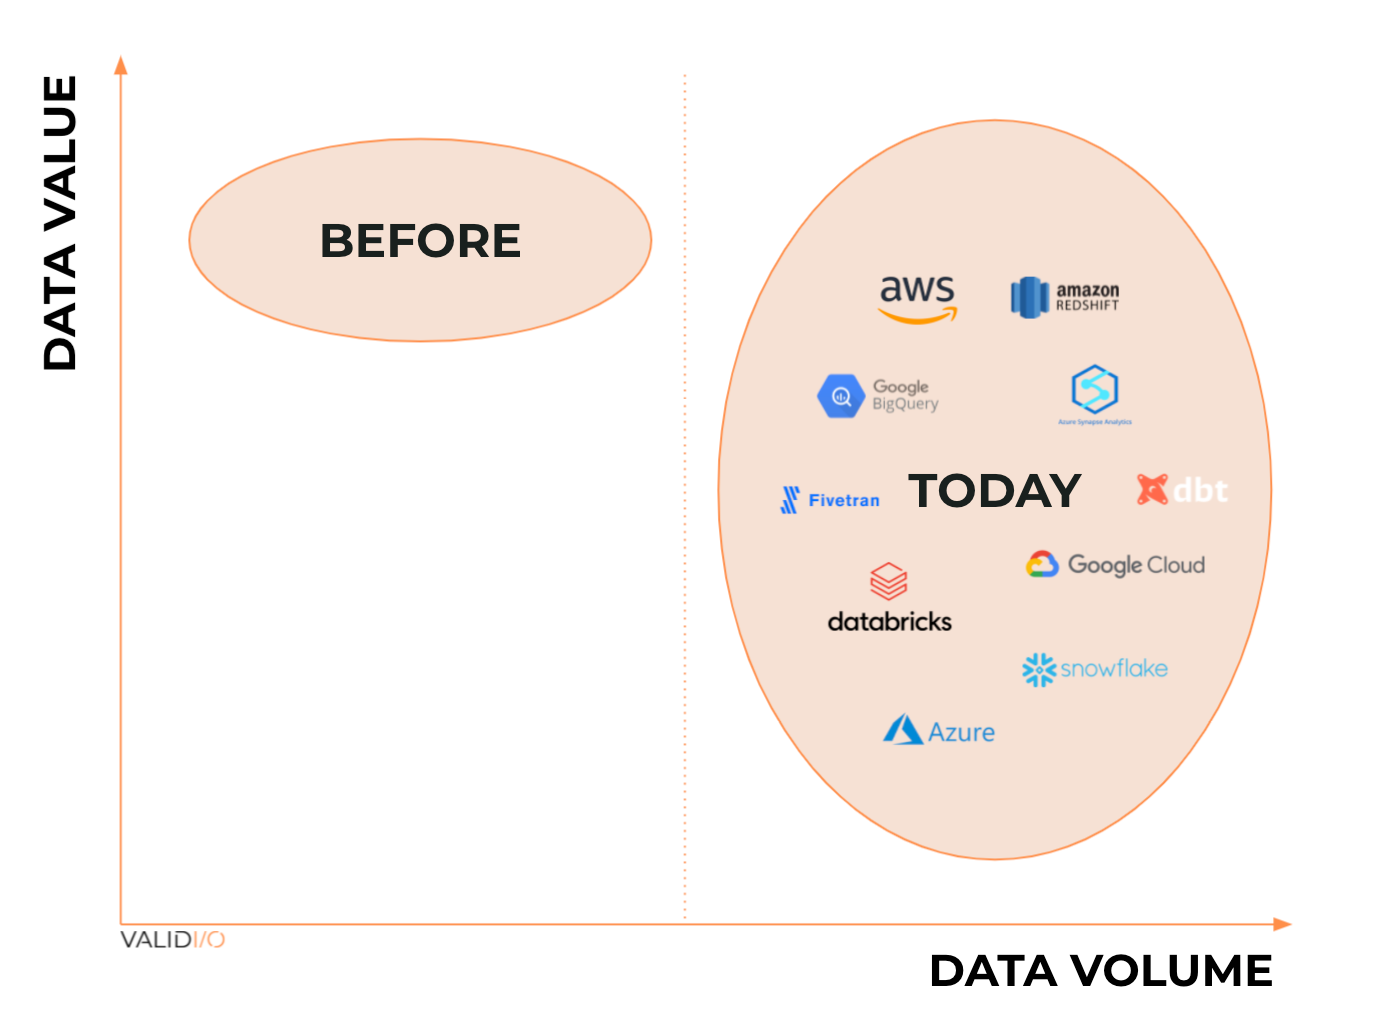
The value vs. volume dilemma of big data
In 2005, Tim O’Reilly published his groundbreaking article “What is Web 2.0?”, truly setting off the big data race. The same year, Roger Mougalas from O’Reilly introduced the term “big data” in its modern context — referring to a large set of data that is virtually impossible to manage and process using traditional BI tools.
Back in 2005, one of the biggest challenges with data was managing large volumes of it, as data infrastructure tooling was expensive and inflexible, and the cloud market was still in its infancy (AWS didn’t publicly launch until 2006). The other was speed: As Tristan Handy from Fishtown Analytics (the company behind dbt) notes, before Redshift launched in 2012, performing relatively straightforward analyses could be incredibly time-consuming even with medium-sized data sets. An entire data tooling ecosystem has since been created to mitigate these two problems.
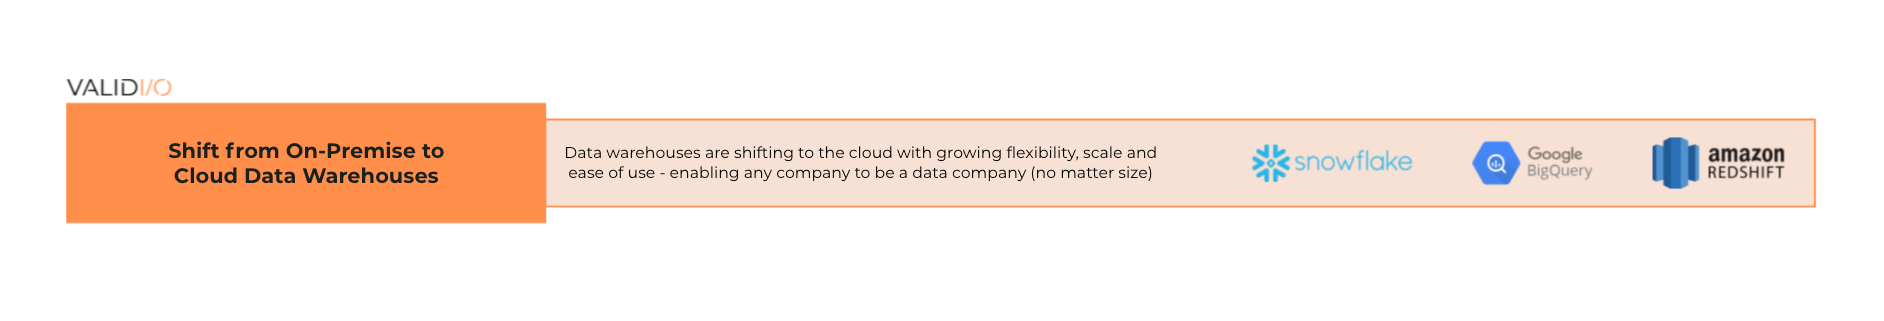
Scaling relational databases and data warehouse appliances used to be a real challenge. Only 10 years ago, a company that wanted to understand customer behavior had to buy and rack servers before its engineers and data scientists could work on generating insights. Data and its surrounding infrastructure was expensive, so only the biggest companies could afford large-scale data ingestion and storage.
Then came a (Red)shift. In October 2012, AWS presented the first viable solution to the scale challenge with Redshift — a cloud-native, massively parallel processing (MPP) database that anyone could use for a monthly price of a pair of sneakers ($100) — about 1,000x cheaper than the previous “local-server” setup. With a price drop of this magnitude, the floodgates opened and every company, big or small, could now store and process massive amounts of data and unlock new opportunities.
As Jamin Ball from Altimeter Capital summarizes, Redshift was a big deal because it was the first cloud-native OLAP warehouse and reduced the cost of owning an OLAP database by orders of magnitude. The speed of processing analytical queries also increased dramatically. And later on (Snowflake pioneered this), they separated computing and storage, which, in overly simplified terms, meant customers could scale their storage and computing resources independently.
What did this all mean? An explosion of data collection and storage.
After 2016, I started to see widespread adoption of scalable modern cloud data warehouses. This was when BigQuery and Snowflake truly entered the race (BigQuery didn’t release standard SQL until 2016 and so wasn’t widely adopted before then, and Snowflake’s product wasn’t truly mature before 2017). Not only did these newcomers solve the volume issue, they were built on a new and different logic that decouples cost for volume and cost for compute.
This meant that a company could store large volumes of data even more cheaply, as it only paid for the data it processed (i.e., consumption-based compute costs and consumption-based storage costs, rather than consumption-based costs for “storage with compute power” for all data).
Before the price drop in storage, companies collected data more selectively (than today) and naturally focused on high-value data. Today, with data storage being dirt cheap and the ongoing move to ELT from ETL following the advent of modern cloud data warehouses and lakes, it’s viable to store massive amounts of data “just in case.”
With the challenge of speed and volume solved, the challenge before us now is to ensure that the large volumes of big data are of sufficiently high quality before they’re used.
Data failures are common, but when data explodes, so does its impact
The data quality space clearly has an issue with definitions. Just like with artificial intelligence, there are almost as many definitions of “data quality” as there are opinions on the subject. In the era of big data, data quality is about preventing and battling data failures.
Data failure is a broad concept that describes situations when the data in a data stream or data set does not behave as expected. Some examples include significant fluctuations in data ingestion rate (for data streams), the number of rows in a data table being greater or smaller than expected, changing data schema, actual data values shifting significantly, or shifts in the relationships between different features in a data set.
Note that this definition of data failures relates to expectations. Data failures can occur even if the newly collected data actually and truthfully represents reality and therefore is free from errors, as long as it differs from expectations (based on which it is used).
In connection with the COVID-19 pandemic, I saw many examples of data failures without underlying data errors. Numerous companies had machine learning models in production, which were trained on historical data. When training machine learning models on historical data, the implicit expectation is that historical data is representative of the new data that the model is supposed to work with. Hence, if new data significantly differs from the historical (training) data, we have a data failure, even if the new data truthfully represents reality.
This blog post by DoorDash describes why they had to retrain their machine learning algorithms in the wake of the COVID-19 pandemic. With lockdowns and all sorts of restrictions on social behavior, more people started ordering in, and more restaurants signed up to DoorDash to be able to cater to the changes in demand.
The new consumption patterns were not captured by the historical data on which DoorDash’s ML-based demand prediction models were trained, so they were quickly rendered useless in the new reality. “ML models rely on patterns in historical data to make predictions, but life-as-usual data can’t project to once-in-a-lifetime events like a pandemic … the COVID-19 pandemic brought demand patterns higher and more volatile than ever before, making it necessary to retrain our prediction models to maintain performance,” DoorDash wrote.
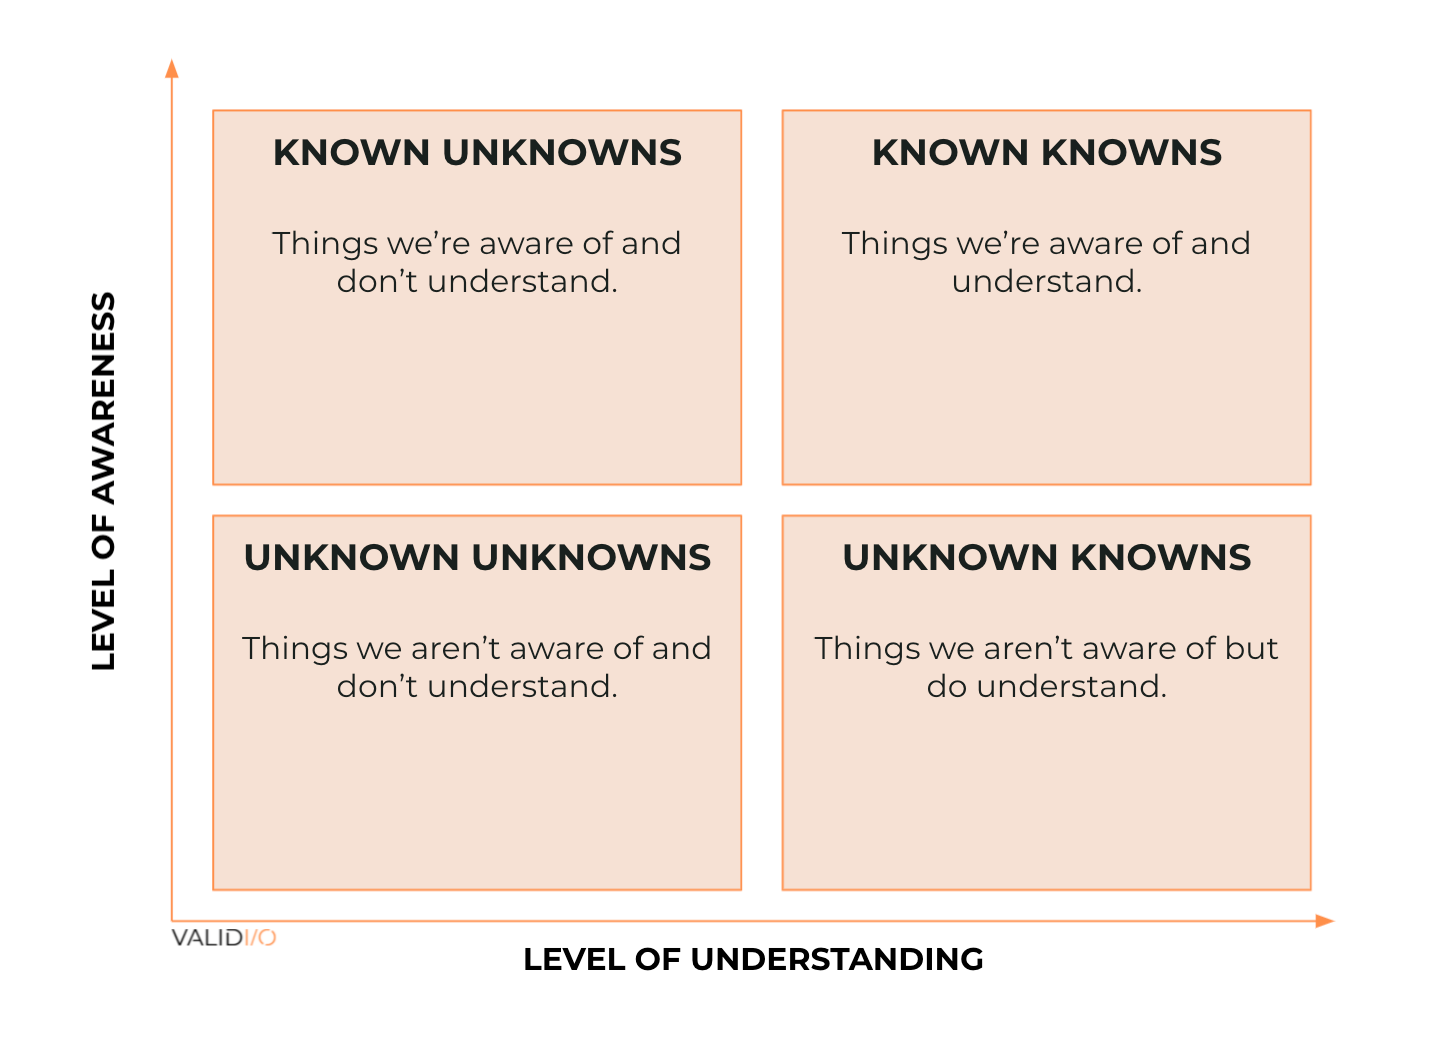
Inspired by former U.S. Secretary of Defense Donald Rumsfeld, I find it useful to divide data failures into four categories based on how aware organizations are of them and how well they understand them. If you plot the categories in a 2×2 matrix, with awareness on the vertical and understanding on the horizontal axis, you get the below diagram.
Note that what is known for one company might be unknown for another, both in terms of awareness and understanding. So while a tempting simplification, it is not meaningful to generally classify different data failures as knowns or unknowns, because this will differ between organizations.
That said, here are a few examples of what the categories in the matrix actually mean in practice:
Known knowns: These are data failures that an organization is aware of and understands, so it’s fairly straightforward to have people implement rules to check for them. These people could be data engineers, data scientists, or business people with domain knowledge about the data in question. For example, rules could govern the format or value range that values in a certain column should have for the data to be valid.
Known unknowns: These data failures are issues that a company is worried about, but lacks the understanding (or resources) to deal with. A couple of years ago, I was advising data teams of big Nordic enterprises. Common complaints from data owners involved constant worries about data from certain sources, because the values that came in were sometimes unreasonable and erroneous. They said, “We do not know how to properly monitor and be proactive, since the errors look different from time to time.”
Unknown knowns: These are data failures that a company is unaware of, but tacitly understands, which may let it handle them once it’s aware of the failures. However, as an organization isn’t aware of a failure before it happens, it is impossible for it to be proactive and define rules and tests to identify them.
For companies with analytical data use cases, in which there is some time between data generation and consumption, usually a human is involved, and they can hopefully analyze the data before it is consumed and learn of potential data failures (turning the unknown known to a known known). However, as data volumes and complexity grow, data failures are often overlooked even by the most knowledgeable people, as humans are not well-suited for high-dimensional pattern recognition or high-volume data processing.
For organizations with operational data use cases, in which data is both generated and consumed in near real time, there is little to no opportunity to have a human in the loop. The knowledge of a potential data failure is of little help, because data failures need to be addressed before the data is consumed, which happens almost right after it is generated.
Statistics Sweden, the organization responsible for producing official statistics for decision-making, debate and research in Sweden, faced the challenge of an unknown known data failure in 2019. It had identified failures in the data collection of the workforce survey, which is used for, among other things, calculating the GDP and unemployment rate of Sweden, which the Swedish government, the Central Bank of Sweden and commercial banks rely on to make crucial decisions.
Notably, there are few organizations in the world that have a higher proportion, or a higher absolute number, of statisticians and data experts than Statistics Sweden, whose raison d’être is to provide high-quality data. In September 2019, Statistics Sweden reported an unemployment rate of 7.1%, but in reality, the true number was closer to 6%.
The reported numbers were so astounding that the Swedish Minister of Finance even reached out to Statistics Sweden to discuss their correctness, but this questioning was not taken seriously enough. The discrepancy was discovered months later and had severe consequences, including the Swedish government having to recalculate Sweden’s GDP for several years back.
In addition, both the central bank and commercial banks in Sweden had based their interest rate decisions on the false sudden increase of unemployment rate. Interpreted as an economic downturn, leading commercial banks assumed that the central bank would keep its rates low (and their lending costs). Subsequently, they lowered their interest rates aggressively.
So what led Statistics Sweden to this enormous mistake? The organization had outsourced parts of the workforce data collection to a consultancy firm that did not follow the proper data collection procedures (including faking data, as double the response rates resulted in a 24x fee, but that’s another ludicrous story), which resulted in erroneous data being collected.
Employees at Statistics Sweden discovered these improper data collection practices by identifying significant discrepancies between internally collected data and the data from the consultancy firm. In addition, control calls were made to survey respondents, who denied ever being involved.
While employees of Statistics Sweden are unarguably knowledgeable enough to understand that data must be properly collected, they were unaware of the incentives of their outsourcing contract and so didn’t have proper checks and balances in place to monitor the quality of the data. As soon as they were made aware, they took corrective actions to try to prevent this from happening again.
Unknown unknowns: These data failures are the most difficult to detect. They are the ones that organizations are neither aware of nor understand, and are the most difficult category to discover.
For instance, an unknown-unknown-driven data failure stemming from a software update recently struck travel and tourism giant TUI. TUI uses average weights to estimate total passenger weight before takeoff, with different standard weights for men, women and children. Total passenger weight is a key input for calculating important flight data such as takeoff thrust and fuel requirements.
In this case, a software update caused the system to mislabel passengers titled “Miss” as “children,” resulting in a 1,200 kg underestimation of total passenger weight for one of their flights. The pilots noted that the estimated weight differed substantially from the weight on the load sheet, and that the number of children shown on the load sheet was unusually high.
However, they discarded their suspicions and took off with lower thrust than required based on the real weight. Luckily, despite several TUI planes making the same error before the data failure was discovered and resolved, none of the planes were above their weight safety margin and no serious harm was caused.
This is the risk of being confronted with an unknown unknown data failure: Even when you are faced with one directly, it might slip under your radar.
Another example is that of peer-reviewed medical journal “The Lancet,” which published a paper in March 2021 claiming that Spain’s child mortality rate due to COVID-19 was up to four times as high as countries like the U.S., U.K., Italy, Germany, France and South Korea. The paper caused a public outburst in Spain, and the data behind the results was scrutinized further, revealing that the paper exaggerated the number of children who died from COVID-19 by almost a factor of eight.
Hacking my way into analytics: A creative’s journey to design with data
The source of the data failure was traced back to the IT system that the Spanish government used to store the data. It could not handle three-digit numbers, resulting in three-digit ages being cropped — so, for instance, a 102-year-old was registered as a two-year-old in the system. Note that highly trained researchers were using this highly erroneous data and let it slip through.
Another example of an unknown-unknown-driven data failure during real-time data consumption concerns Instacart’s product availability predictions across stores. Predictions are used to inform customers which products in their shopping baskets are in stock and can be delivered upon an order. Prior to the pandemic, the accuracy of Instacart’s inventory prediction model was 93%, but when the pandemic hit, that number dropped to 61%, as people started to drastically change their shopping behavior.
The machine-learning-based prediction models were trained on weeks of historical data, but the system could not deal with the unexpected hoarding of toilet paper, hand sanitizers and staple foods. Only when the models’ performance had deteriorated significantly (and cost a lot of money in terms of lost sales and unhappy customers) did engineers at Instacart begin to sense that something was wrong. The machine learning team at Instacart were neither aware of the potential of a data failure caused by a significant shift in behavior, nor did they have sufficient knowledge to recognize it when it happened (i.e., recognize the significant shift in input data failure before the data was consumed).
The above examples of known and unknown data failures are just the tip of the iceberg. Data failures happen all the time in data-driven organizations, and I have seen many with more severe consequences than the cases discussed above. However, most companies are embarrassed about them and, so, rarely discuss them in public.
Observability is necessary, but not sufficient
With the evident need for solutions to ensure high data quality in the big data era, the space has received a lot of attention — especially during the past year. If you’ve paid attention to the data quality space lately, you’re likely familiar with the term observability. I’m seeing an increasing number of data quality monitoring startups from different backgrounds using the term to describe their solutions, many claiming their observability tool as the factor that will take businesses to the next level.
“Observability” has been adopted from the world of DevOps — I’ve seen plenty of observability startups proclaiming they will be the “Datadog of data.” This is largely due to the notion that it will smoothen sales processes/product adoption, as tech teams are familiar with the term from the world of application performance and cloud software monitoring.
In the context of data quality, the observability approach essentially means monitoring data pipelines’ metadata to ensure that data is fresh and complete — ensuring that data is flowing through the pipeline as expected. These solutions may also provide some high-level information about data set schema and error distributions (like missing values), paired with some data lineage solution.
Data observability is a good first step to address an underserved need among data-driven companies, but it is far from sufficient, as it pays little or no attention to issues in the actual data within the data pipelines. There are countless examples of data failures that are not evident from the metadata level and can wreak total havoc in the pipelines while everything looks fine and dandy from a data observability standpoint.
None of the previously described data failures of Statistics Sweden, TUI, the Spanish COVID-19 data or Instacart could be discovered with a data observability tool. This is because the metadata was normal in all the cases: Data was complete, fresh and with normal schema and error distributions. The failures could only have been discovered by looking at the actual data and its values.
In other words, observability is a subset of data quality monitoring, but it’s far from the whole story.
Why traditional ways to identify data failures don’t work
Before I explain how to go about identifying data failures in the big data era, let’s revisit how data failures were identified when volumes were low and values were high (per data point). There were three common approaches:
Reactive: Data failures were dealt with reactively when they grew painful — when errors in dashboards, BI reports or other data products were picked up by the consumers of data products. Given that the damage is already done when the data failures are identified in this way, this approach is not suitable in organizations where data is used for critical purposes.
Manual: Data scientists (note that this was before the era of data engineers) were employed to manually ensure the quality of collected data by analyzing new data (often column by column) and comparing it to historical data to identify potential significant deviations and unreasonable values. Compared to the first approach, this is more proactive, but not at all scalable.
Rule-based: More data-ready organizations often had real-time operational use cases for collected data. When data is consumed almost immediately after it is collected, it is virtually impossible to manually ensure its quality. These companies got internal data consumers with domain knowledge about the data to add a plethora of rules to their data pipelines based on reasonable thresholds.
The rules were often part of big master data management systems. However, these inflexible behemoth systems were a solid recipe for inertia, as rules need to be redefined when their surroundings change (e.g., when migrating to the cloud).
A reactive approach to data quality has always been out of the question when data is applied to use cases where the value (and therefore, the cost of mistakes) is high, which is increasingly the case in the big data era. The alternatives of having a human in the loop or defining hard-coded rules are impractical for several reasons.
Firstly, the vast amount of data makes manual and rule-based approaches unviable. The volume and velocity of big data make it difficult to have humans in the loop, and the variety of data makes rules too inflexible (the “three V’s of big data”). Our limited capacity to identify patterns in high-dimensional data leaves us inept at understanding (and recognizing) the different kinds of data failures and too limited in our awareness to be able to foresee (and create rules) to codify and capture them proactively.
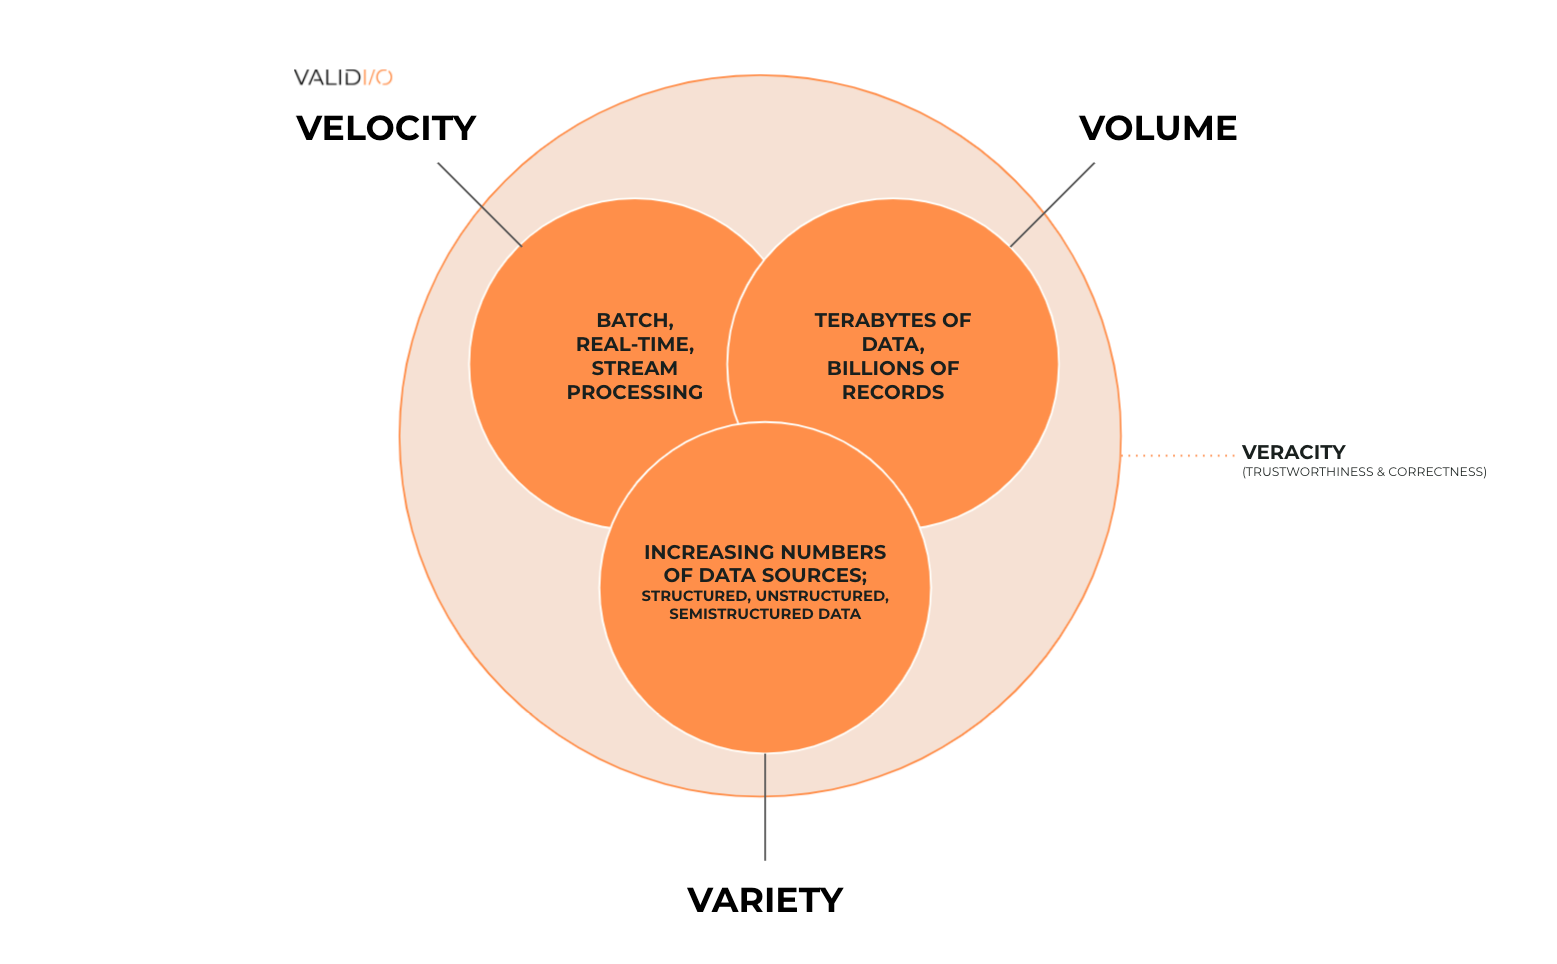
As data quality has created several new contextual issues, a fourth “V” has been introduced: veracity. In general, veracity refers to the degree of correctness or trustworthiness of the data. It’s fair to say that data veracity, even though always present in data science, has historically dwelt under the shadow of the other V’s (volume, velocity and variety).
This is changing as only correct and trustworthy data can add value to analytics and machine learning models today. The emphasis on veracity will be accelerated by growing data volumes, variety and sources. Upcoming regulatory initiatives, such as the EU AI Regulation, are also directing the focus toward veracity.
Secondly, modern data infrastructures and accompanying development of modern data pipelines have increased data pipeline complexity significantly, which results in additional potential sources of data failures.
Thirdly, given the vast amount of data sources, manually defining rules to monitor each source has become a huge task. It takes a lot of time to understand data sources well enough to define proper rules, and the rules must also be updated continuously as data changes over time.
Lastly, and maybe most importantly, the traditional approaches of manual and/or rule-based data quality monitoring are unable to capture the unknown data failures that an organization either doesn’t understand or is unaware of. The unknown data failures are often not only the most difficult to identify, they are also the most costly to miss.
How to identify (unknown) data failures in the era of big data
Effective approaches to data quality monitoring will need to take into account a handful of secular trends that impact how data is used and how quality can be managed proactively and scalably.
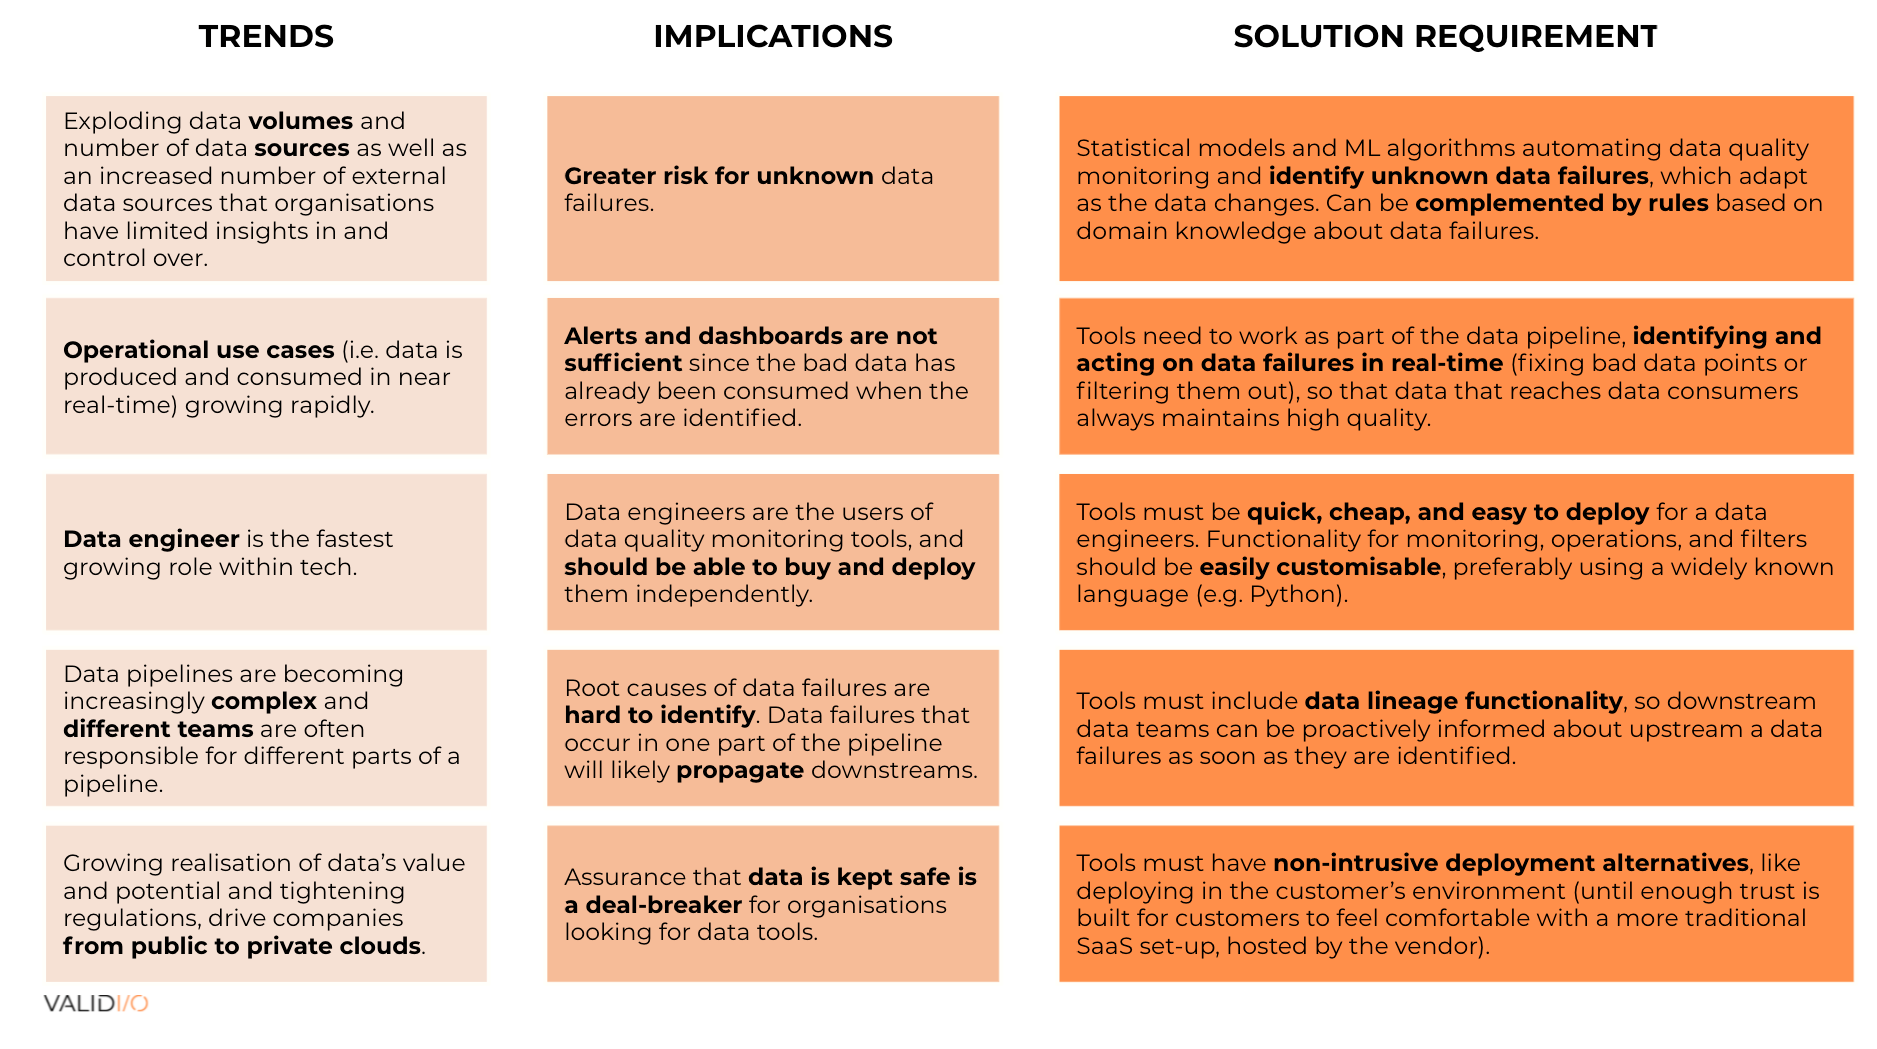
Modern data quality solutions need to use statistical models and machine learning algorithms to complement rule-based approaches to identify unknown data failures in a scalable and adaptable way as data changes over time. Solutions also should be able to operate on data that flows through data pipelines in real time to cater to operational use cases in which data is produced and consumed in near real time.
Data engineers should be able to use these solutions, which means they should be easy to deploy without going through a cumbersome procurement process, and be customizable. These solutions should also include data lineage functionality so that information about data failures upstream will reach the affected data teams downstream proactively.
And lastly, they should have non-intrusive deployment alternatives so that security is never an issue for customers.
Moving along the data quality maturity scale
After speaking with hundreds of data teams over the last few years, I have found that modern data-driven companies usually go through different stages of maturity when it comes to ensuring high data quality.
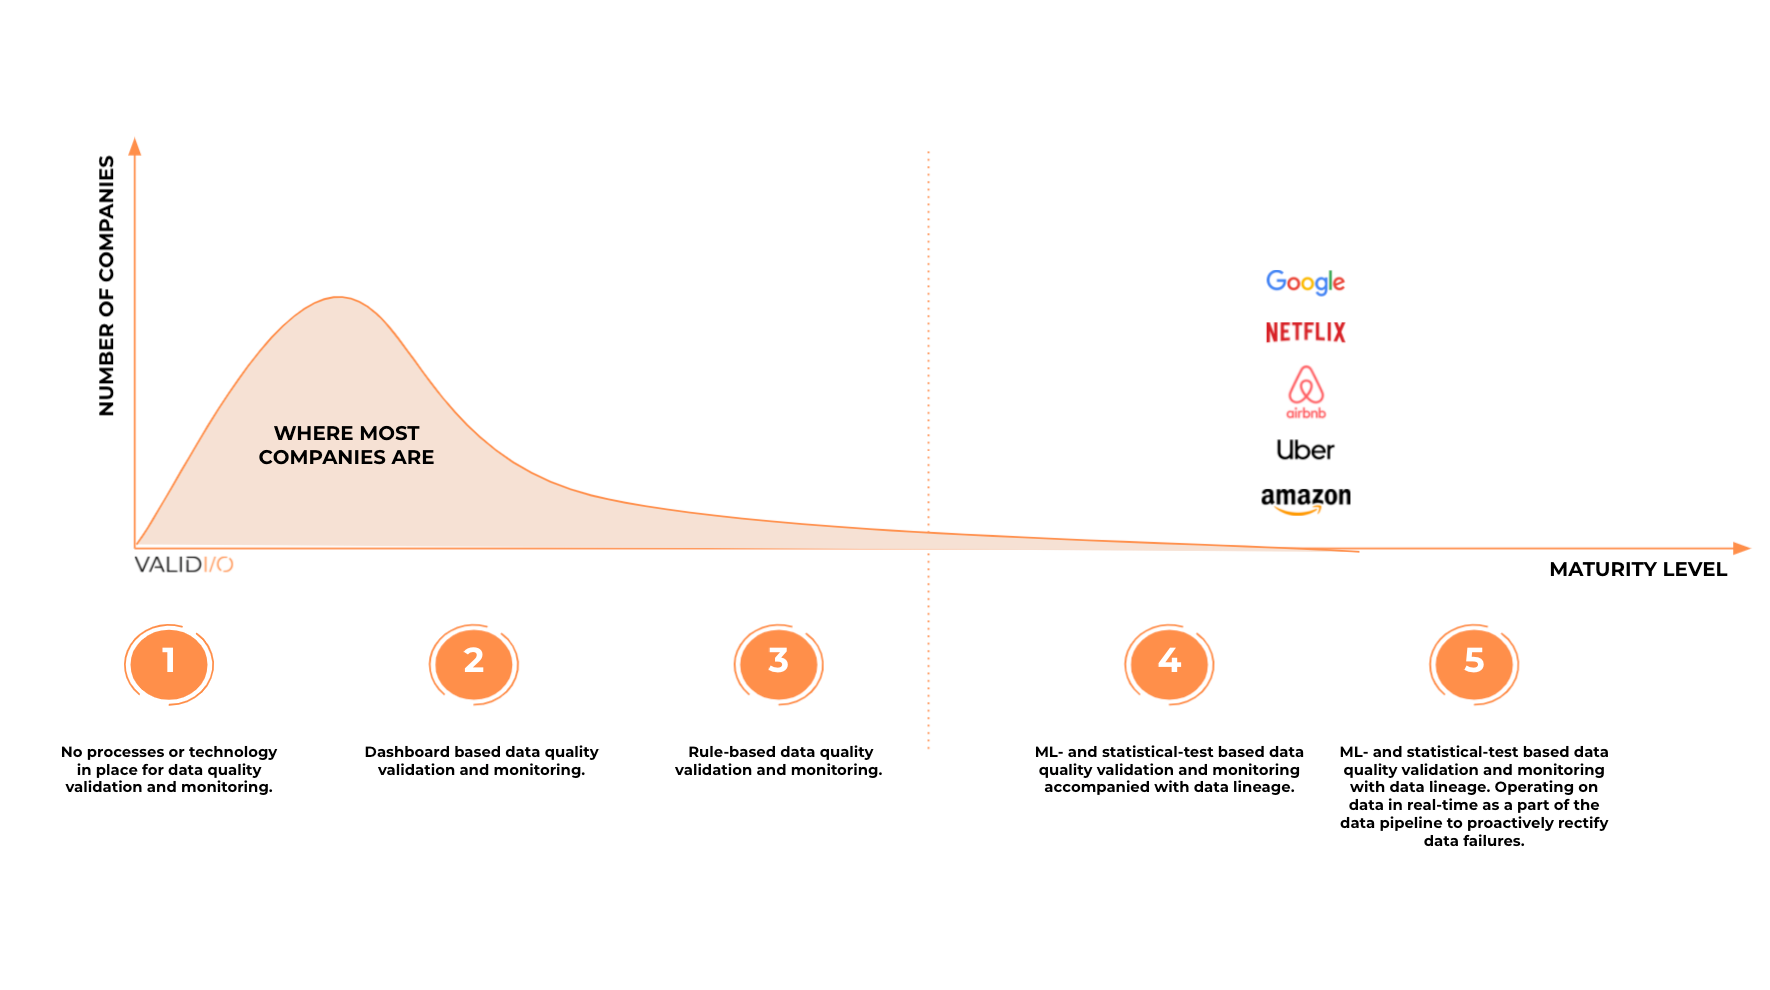
Level 1 — Basic: No processes or technology to monitor or identify data quality issues. Data quality problems usually take weeks or months to resolve and are identified by downstream users/customers when problems have already occurred.
Level 2 — Starter: Dashboards are used to monitor data patterns to be able to react quickly as data quality issues arise. It can still take weeks to find and resolve the root cause, though, especially in complex data pipelines.
Level 3 — Medium: Rule-based systems are used to identify data quality problems, which can be addressed as they occur. But there aren’t any advanced systems in place to detect unknown data failures.
Level 4 — Advanced: Rule-based systems are complemented by ML-and-statistical-test-based systems that identify both known and unknown data failures. Data lineage is used to identify the origins of data failures to make it easy to identify the error source. Furthermore, the lineage enables one to proactively notify all downstream data teams dependent on the failed data.
Level 5 — Expert: In addition to ML algorithms, statistical tests and rules to keep track of data quality and data lineage, there are tools to operate on and filter data in real time to rectify data failures until their root causes have been resolved so that failures are curbed from contaminating the data pipeline downstream.
Companies at Levels 1-3 employ approaches from the time before the big data era. These approaches are easy to get started with, but data-driven companies tend to realize quickly that they neither scale well nor do they identify unknown data failures.
Companies at Level 4 identify unknown data failures in a scalable way. Alerts based on input data failures are more proactive than finding failures based on errors, but they are not sufficient for operational use cases since the identified data failures are not mitigated in real time.
At Level 5, proactivity is tangible as companies pair monitoring with interventions. Pairing Level 4 functionality with automated operations on the data prevents data failures from propagating through the pipeline by filtering out bad data from the main data pipeline or via automated fixes for different data failures that tidy up the data points as they flow through the pipeline.
The million-dollar question: Buy or build?
The answer to the buy or build question depends on the level of maturity a company is aiming for and the resources at its disposal. Generally, a higher level of maturity will cost more to build and maintain.
Many companies can build solutions for Levels 1-3 from scratch or by leveraging tools like Grafana, dbt, Great Expectations and Deequ. However, building proprietary solutions for Level 4 requires using statistical tests and machine learning algorithms in highly generalizable ways to identify unknown data failures.
As monitoring relies less on domain knowledge and more on comprehensive, generalizable pattern recognition, data quality monitoring companies have an edge simply because for most companies, domain knowledge is core business, but generalizable pattern recognition is not.
At Level 5, system performance requirements are a completely different ballgame. Levels 1-4 concern a range of sophisticated ways to identify data failures so that humans can prioritize how and when to react. To build increasingly generalizable and dynamic pattern recognition and rules, you need a solid understanding of the data, ML and statistics (and software development, of course). These skills are also needed for Level 5, but fixing data in real time for operational use cases virtually requires the systems to be as performant as one’s ETL/ELT pipeline.
What I’ve seen is that companies usually keep DIY solutions at Level 1-3, where their quality monitoring primarily relies on domain knowledge of the data. When they want to scale the monitoring (often because they want to scale their data pipelines) and move toward Levels 4 or 5, they begin looking for external best-of-breed solutions.
Some of the biggest and most data-driven companies out there have managed to build DIY solutions at Level 4, but they are few. Less than a year ago, for example, Uber’s engineering team shared some details about their proprietary solution for cross-infrastructure data quality monitoring. The solution took five data scientists and engineers a year to build and will require ongoing investment to maintain.
This is a pretty lofty investment for most companies, especially as good data scientists and engineers are a scarce resource, to say the least. At Uber’s scale, there may be enough ROI to justify a highly customized in-house solution, but that’s probably an anomaly.


Comment